Perf 使用手册
安装
安装 perf
apt install -y perf
安装 flamegraph
火焰图是脚本,只需要下载:
git clone https://github.com/brendangregg/FlameGraph.git
认识 Perf
下面将由一个最简单的perf命令,初步了解perf的功能:
perf stat -e cycles ls
Performance counter stats for 'ls':

          1040224      cycles

      0.001632667 seconds time elapsed

      0.001925000 seconds user
      0.000000000 seconds sys
上述命令将展示,执行ls这一条命令,cpu运行了多少条指令。
而perf中还能提供更多的此种信息,例如ls命令运行时执行了多少条分支跳转指令,分支跳转预测的成功概率又是多少,在这期间发生了多少次上下文切换,多少次page fault,cache的命中率又如何,等等。
perf list
branch-instructions OR branches                    [Hardware event]
branch-misses                                      [Hardware event]
cache-misses                                       [Hardware event]
... ...

context-switches OR cs                             [Software event]
page-faults OR faults                              [Software event]
... ...

L1-dcache-load-misses                              [Hardware cache event]
L1-dcache-loads                                    [Hardware cache event]
... ...

block:block_bio_backmerge                          [Tracepoint event]
clk:clk_enable                                     [Tracepoint event]
dma_fence:dma_fence_destroy                        [Tracepoint event]
... ...
其中
- hardware event 是硬件相关的观测点
- software event 是软件相关的观测点
- hardware cache event 是cache相关的观测点
- tracepoint event 是内核设置的观测点
Perf 功能概览
perf有很多子命令,之前的例子中用到的stat只是其中之一
perf
annotate        Read perf.data (created by perf record) and display annotated code
archive         Create archive with object files with build-ids found in perf.data file
bench           General framework for benchmark suites
buildid-cache   Manage build-id cache.
buildid-list    List the buildids in a perf.data file
c2c             Shared Data C2C/HITM Analyzer.
config          Get and set variables in a configuration file.
data            Data file related processing
diff            Read perf.data files and display the differential profile
evlist          List the event names in a perf.data file
ftrace          simple wrapper for kernel's ftrace functionality
inject          Filter to augment the events stream with additional information
kallsyms        Searches running kernel for symbols
kmem            Tool to trace/measure kernel memory properties
kvm             Tool to trace/measure kvm guest os
list            List all symbolic event types
lock            Analyze lock events
mem             Profile memory accesses
record          Run a command and record its profile into perf.data
report          Read perf.data (created by perf record) and display the profile
sched           Tool to trace/measure scheduler properties (latencies)
script          Read perf.data (created by perf record) and display trace output
stat            Run a command and gather performance counter statistics
test            Runs sanity tests.
timechart       Tool to visualize total system behavior during a workload
top             System profiling tool.
version         display the version of perf binary
probe           Define new dynamic tracepoints
perf的子命令大致可分为2类
- 基础子命令:用于做一些性能数据的列举,统计和展示
- 功能型子命令:针对特定的功能进行数据的采样和分析
基础子命令
| 子命令名 | 作用 |
|---|---|
| list | 列出当前系统支持的所有事件,分为4种类型:hardware event,software event,hardware cache event,tracepoint event |
| stat | 执行某个命令,收集特定进程的性能概况 |
| record | 收集采样信息,并将其记录在数据文件中,随后可通过其它工具对数据文件进行分析 |
| report | 读取perf record创建的数据文件,并给出分析结果 |
| probe | 动态增加tracepoint |
| script | 执行perl或python写的功能扩展脚本、生成脚本框架、读取数据文件中的数据信息等 |
| timechart | 分析CPU在一段时间内的使用情况 |
功能型子命令
| 子命令名 | 作用 |
|---|---|
| lock | 分析内核中锁的使用情况 |
| kmem | 分析内核slab的使用情况 |
| sched | 分析内核调度事件的情况 |
| top | top的升级版本,能够看到各个进程实时运行的函数 |
| bench | perf内部的一个benchmark本城 |
| evlist | 查看perf.data采样了的事件 |
| kallsyms | 判别一个符号是否在当前运行的kernel中导出 |
Perf 基础子命令
perf list
perf list
branch-instructions OR branches                    [Hardware event]
branch-misses                                      [Hardware event]
bus-cycles                                         [Hardware event]
cache-misses                                       [Hardware event]
cache-references                                   [Hardware event]
cpu-cycles OR cycles                               [Hardware event]
instructions                                       [Hardware event]
ref-cycles                                         [Hardware event]
stalled-cycles-backend OR idle-cycles-backend      [Hardware event]
stalled-cycles-frontend OR idle-cycles-frontend    [Hardware event]
... ...

alignment-faults                                   [Software event]
bpf-output                                         [Software event]
context-switches OR cs                             [Software event]
cpu-clock                                          [Software event]
cpu-migrations OR migrations                       [Software event]
dummy                                              [Software event]
emulation-faults                                   [Software event]
major-faults                                       [Software event]
minor-faults                                       [Software event]
... ...

L1-dcache-load-misses                              [Hardware cache event]
L1-dcache-loads                                    [Hardware cache event]
L1-dcache-store-misses                             [Hardware cache event]
L1-dcache-stores                                   [Hardware cache event]
LLC-load-misses                                    [Hardware cache event]
LLC-loads                                          [Hardware cache event]
LLC-store-misses                                   [Hardware cache event]
LLC-stores                                         [Hardware cache event]
... ...

block:block_bio_backmerge                          [Tracepoint event]
clk:clk_enable                                     [Tracepoint event]
dma_fence:dma_fence_destroy                        [Tracepoint event]
ext4:ext4_alloc_da_blocks                          [Tracepoint event]
gadget:usb_ep_alloc_request                        [Tracepoint event]
irq:irq_handler_exit                               [Tracepoint event]
irq:softirq_entry                                  [Tracepoint event]
irq:softirq_exit                                   [Tracepoint event]
irq:softirq_raise                                  [Tracepoint event]
jbd2:jbd2_checkpoint                               [Tracepoint event]
kmem:kmalloc                                       [Tracepoint event]
mmc:mmc_request_done                               [Tracepoint event]
neigh:neigh_update_done                            [Tracepoint event]
net:napi_gro_frags_entry                           [Tracepoint event]
nfs4:ff_layout_commit_error                        [Tracepoint event]
oom:compact_retry                                  [Tracepoint event]
page_pool:page_pool_release                        [Tracepoint event]
pagemap:mm_lru_activate                            [Tracepoint event]
percpu:percpu_alloc_percpu                         [Tracepoint event]
power:clock_disable                                [Tracepoint event]
rcu:rcu_utilization                                [Tracepoint event]
regmap:regcache_drop_region                        [Tracepoint event]
regmap:regmap_reg_write                            [Tracepoint event]
rpcgss:rpcgss_bad_seqno                            [Tracepoint event]
sched:sched_kthread_stop                           [Tracepoint event]
signal:signal_deliver                              [Tracepoint event]
skb:consume_skb                                    [Tracepoint event]
smbus:smbus_read                                   [Tracepoint event]
sock:inet_sock_set_state                           [Tracepoint event]
spi:spi_controller_busy                            [Tracepoint event]
swiotlb:swiotlb_bounced                            [Tracepoint event]
task:task_newtask                                  [Tracepoint event]
tcp:tcp_destroy_sock                               [Tracepoint event]
timer:hrtimer_cancel                               [Tracepoint event]
vmscan:mm_shrink_slab_end                          [Tracepoint event]
workqueue:workqueue_activate_work                  [Tracepoint event]
writeback:balance_dirty_pages                      [Tracepoint event]
其中主要分为4种类型的采样事件
- hardware event 是硬件相关的观测点
- software event 是软件相关的观测点
- hardware cache event 是cache相关的观测点
- tracepoint event 是内核设置的观测点
perf stat
perf stat子命令可以采样perf list种展示的4种类型的数据,并展示。
同时,perf stat子命令也具有相当多的参数,其中,-e参数用来指定具体的event,是必选的。
perf stat -h
-a, --all-cpus        system-wide collection from all CPUs
-A, --no-aggr         disable CPU count aggregation
-B, --big-num         print large numbers with thousands' separators
-C, --cpu <cpu>       list of cpus to monitor in system-wide
-D, --delay <n>       ms to wait before starting measurement after program start (-1: start with events disabled)
-d, --detailed        detailed run - start a lot of events
-e, --event <event>   event selector. use 'perf list' to list available events
-G, --cgroup <name>   monitor event in cgroup name only
-g, --group           put the counters into a counter group
... ...
实例:
hardware event:
perf stat -e instructions ls
Performance counter stats for 'ls':

           267995      instructions
... ...
可以看到,执行ls,cpu运行了267995条指令
software event:
perf stat -e context-switches,page-faults dmesg
Performance counter stats for 'dmesg':

                6      context-switches
               35      page-faults
... ...
可以看到,执行dmesg,cpu发生了6次上下文切换,35次page fault
hardware cache event:
perf stat -e L1-dcache-store-misses ls
Performance counter stats for 'ls':

              365      L1-dcache-store-misses
... ...
可以看到,执行ls,cpu发生了365次L1 cache的store miss(写不命中)
tracepoint event:
tracepoint event本身就分为很多种类型,例如:block:block_bio_backmerge,就表示block这个类型的block_bio_backmerge这个采样点。
tracepoint event支持采样类型和采样点非常多,有clk,mmc,sched等类型,而其中每个采样类型又分为更多的采样点,因此,可以通过perf list后面跟上采样类型的名字,来查看某个特性类型的采样点。
perf list sched
sched:sched_kthread_stop                           [Tracepoint event]
sched:sched_kthread_stop_ret                       [Tracepoint event]
sched:sched_migrate_task                           [Tracepoint event]
sched:sched_move_numa                              [Tracepoint event]
sched:sched_pi_setprio                             [Tracepoint event]
sched:sched_process_exec                           [Tracepoint event]
sched:sched_process_exit                           [Tracepoint event]
sched:sched_process_fork                           [Tracepoint event]
sched:sched_process_free                           [Tracepoint event]
sched:sched_process_hang                           [Tracepoint event]
sched:sched_process_wait                           [Tracepoint event]
sched:sched_stat_runtime                           [Tracepoint event]
sched:sched_stick_numa                             [Tracepoint event]
sched:sched_swap_numa                              [Tracepoint event]
sched:sched_switch                                 [Tracepoint event]
sched:sched_wait_task                              [Tracepoint event]
sched:sched_wake_idle_without_ipi                  [Tracepoint event]
sched:sched_wakeup                                 [Tracepoint event]
sched:sched_wakeup_new                             [Tracepoint event]
sched:sched_waking                                 [Tracepoint event]
可以看到,一个sched类型,对应很多采样点。
这些采样点由内核代码中已经写好的代码构成,例如:
2458 static void ttwu_do_wakeup(struct rq *rq, struct task_struct *p, int wake_flags,
2459                struct rq_flags *rf)
2460 {
2461     check_preempt_curr(rq, p, wake_flags);
2462     p->state = TASK_RUNNING;
2463     trace_sched_wakeup(p);
         ... ...
第2463行的trace_sched_wakeup就是一个tracepoint,对应着sched:sched_wakeup这个采样点。
4410 static void __sched notrace __schedule(bool preempt)
4411 {
             ... ...
4525         trace_sched_switch(preempt, prev, next);
             ... ...
第4525行的trace_sched_switch就是一个tracepoint,对应着sched:sched_switch这个采样点。
通过perf stat子命令可以得到观测结果
perf stat -e sched:sched_switch -a sleep 1
Performance counter stats for 'system wide':

               29      sched:sched_switch
可以看到,执行ls,cpu运行了29次sched_switch,也就是对应的__schedule函数。
但看这个效果,貌似tracepoint event功能并不强大,但其实tracepoint event最强大的地方在于时间的统计,内核中每个采样点都代表了一些重要的时刻,比如,进程切换了,调度器把进程放入runqueue,或者开始真正的进程运行,都会加上一个tracepoint,来记录时间,从而为分析和调试提供支持。
perf record & perf report
perf stat子命令展示的是即时的数据,若想要获取更多信息,则需要用perf record子命令将信息组成一个perf.data文件,并利用perf report将其解析并展示出来。
同样的,perf record和perf report子命令也具有相当多的参数,其中,-e参数用来指定具体的event,是必选的
perf record -h
-a, --all-cpus        system-wide collection from all CPUs
-b, --branch-any      sample any taken branches
-B, --no-buildid      do not collect buildids in perf.data
-c, --count <n>       event period to sample
-C, --cpu <cpu>       list of cpus to monitor
-d, --data            Record the sample addresses
-D, --delay <n>       ms to wait before starting measurement after program start (-1: start with events disabled)
-e, --event <event>   event selector. use 'perf list' to list available events
... ...
perf report -h
-b, --branch-stack    use branch records for per branch histogram filling
-c, --comms <comm[,comm...]>
only consider symbols in these comms
-C, --cpu <cpu>       list of cpus to profile
... ...
实例
hardware event:
perf record -e instructions -a ls
perf.data
[ perf record: Woken up 1 times to write data ]
[ perf record: Captured and wrote 0.018 MB perf.data (19 samples) ]
可以看到,perf record子命令生成了一个perf.data;继续用perf report解析并展示这个perf.data
perf report
# Samples: 19  of event 'instructions'
# Event count (approx.): 767713
#
# Overhead  Command  Shared Object      Symbol
# ........  .......  .................  ...............................
    11.71%  ls       busybox            [.] 0x0000000000018954
    11.67%  ls       [kernel.kallsyms]  [k] fput
    11.64%  ls       [kernel.kallsyms]  [k] ___might_sleep
    10.72%  ls       [kernel.kallsyms]  [k] do_page_fault
     8.83%  perf     [kernel.kallsyms]  [k] free_pages_and_swap_cache
     8.27%  perf     [kernel.kallsyms]  [k] unmap_page_range
     7.54%  perf     [kernel.kallsyms]  [k] page_remove_rmap
     7.14%  perf     [kernel.kallsyms]  [k] __alloc_pages_nodemask
     7.02%  perf     [kernel.kallsyms]  [k] __asm_copy_to_user
     5.85%  perf     [kernel.kallsyms]  [k] dput.part.30
     4.21%  perf     [kernel.kallsyms]  [k] handle_mm_fault
     1.78%  perf     [kernel.kallsyms]  [k] seq_printf
     1.49%  swapper  [kernel.kallsyms]  [k] finish_task_switch
     1.07%  perf     [kernel.kallsyms]  [k] _raw_spin_unlock_irqrestore
     1.07%  perf     [kernel.kallsyms]  [k] fput
     0.00%  perf     [kernel.kallsyms]  [k] generic_exec_single
可以看到,perf report子命令不光展示了cpu执行ls所运行的instruction数,还展示了这些指令数都消耗在哪些进程和函数中。
software event:
perf record -e context-switches -a sleep 1
[ perf record: Woken up 1 times to write data ]
[ perf record: Captured and wrote 0.018 MB perf.data (17 samples) ]

# perf report
# Samples: 17  of event 'context-switches'
# Event count (approx.): 36
#
# Overhead  Command          Shared Object     Symbol
# ........  ...............  ................  ......................
    47.22%  swapper          [unknown]         [.] 0000000000000000
    11.11%  perf             [unknown]         [.] 0000000000000000
     8.33%  kcompactd0       [unknown]         [.] 0000000000000000
     8.33%  kworker/0:1-eve  [unknown]         [.] 0000000000000000
     8.33%  rcu_sched        [unknown]         [.] 0000000000000000
     5.56%  kworker/1:0-mm_  [unknown]         [.] 0000000000000000
     5.56%  sleep            [unknown]         [.] 0000000000000000
     2.78%  migration/0      [unknown]         [.] 0000000000000000
     2.78%  ntpd             [unknown]         [.] 0000000000000000
可以看到,perf report子命令不光展示了cpu执行sleep 1时发生的上下文切换次数,还展示了这切换都分布在哪些进程中。
hardware cache event:
perf record -e L1-dcache-load-misses -a ls
perf.data      perf.data.old
[ perf record: Woken up 1 times to write data ]
[ perf record: Captured and wrote 0.018 MB perf.data (3 samples) ]

# perf report
# Samples: 3  of event 'L1-dcache-load-misses'
# Event count (approx.): 4098
#
# Overhead  Command  Shared Object      Symbol
# ........  .......  .................  .......................
    99.95%  ls       busybox            [.] 0x00000000000c293c
     0.05%  perf     [kernel.kallsyms]  [k] generic_exec_single
可以看到,perf report子命令不光展示了cpu执行ls时发生的L1 dcache load miss次数,还展示了这些miss都分布在哪些进程和函数中。
tracepoint event:
perf record -e sched:sched_switch -a ls
perf.data      perf.data.old
[ perf record: Woken up 1 times to write data ]
[ perf record: Captured and wrote 0.019 MB perf.data (10 samples) ]
# perf report
# To display the perf.data header info, please use --header/--header-only options.
#
#
# Total Lost Samples: 0
#
# Samples: 10  of event 'sched:sched_switch'
# Event count (approx.): 10
#
# Overhead  Command      Shared Object     Symbol
# ........  ...........  ................  ......................
#
    40.00%  swapper      [unknown]         [.] 0000000000000000
    30.00%  perf         [unknown]         [.] 0000000000000000
    10.00%  ls           [unknown]         [.] 0000000000000000
    10.00%  migration/0  [unknown]         [.] 0000000000000000
    10.00%  migration/1  [unknown]         [.] 0000000000000000
可以看到,perf report子命令不光展示了cpu执行ls时发生的运行至sched:sched_switch这个tracepoint的次数,还展示了这tracepoint都分布在哪些进程中。
小结一下,对比stat和record,会发现,stat记录的数据是一种counting(计数)类型的数据,而record记录的是一种sampling(采样)类型的数据;record的原理是依赖定期地中断上报来搜集cpu运行状态的信息,所以负荷也会比stat高一些。
perf probe
有的时候,tracepoint不能满足分析过程中的需求,比如在pick_next_task_fair这个函数里没有任何tracepoint,那该如何对这个函数的调用情况进行分析呢?这时候就可以利用perf probe动态地设置一个tracepoint
perf probe pick_next_task_fair
Added new event:
  probe:pick_next_task_fair (on pick_next_task_fair)

You can now use it in all perf tools, such as:

        perf record -e probe:pick_next_task_fair -aR sleep 1
perf probe --list
probe:pick_next_task_fair (on pick_next_task_fair)
可以看到,perf probe子命令已经设置了一个新的tracepoint,类型是probe,采样点是pick_next_task_fair
接下来可以通过之前介绍过的perf stat和perf record/report来采样和解析以及展示
perf stat -e probe:pick_next_task_fair -a sleep 1
 Performance counter stats for 'system wide':

                24      probe:pick_next_task_fair

# perf record -e probe:pick_next_task_fair -a sleep 1
[ perf record: Woken up 1 times to write data ]
[ perf record: Captured and wrote 0.020 MB perf.data (28 samples) ]

# perf report
#
# Samples: 28  of event 'probe:pick_next_task_fair'
# Event count (approx.): 28
#
# Overhead  Command          Shared Object      Symbol
# ........  ...............  .................  .......................
    50.00%  swapper          [unknown]          [.] 0xffffffe000245b6e
     7.14%  kcompactd0       [unknown]          [.] 0xffffffe000245b6e
     7.14%  perf             [unknown]          [.] 0xffffffe000245b6e
     7.14%  rcu_sched        [unknown]          [.] 0xffffffe000245b6e
     7.14%  sleep            [unknown]          [.] 0xffffffe000245b6e
     3.57%  khungtaskd       [unknown]          [.] 0xffffffe000245b6e
     3.57%  kworker/0:1-eve  [unknown]          [.] 0xffffffe000245b6e
     3.57%  kworker/1:0-eve  [unknown]          [.] 0xffffffe000245b6e
     3.57%  migration/0      [kernel.kallsyms]  [k] pick_next_task_fair
     3.57%  migration/1      [kernel.kallsyms]  [k] pick_next_task_fair
     3.57%  ntpd             [unknown]          [.] 0xffffffe000245b6e
该功能其实依赖了kprobe,这种动态设置的方法实际上是利用的kprobe的功能,只不过perf将其集成为自己的一个功能项(子命令),使perf本身成为了一个入口(前端),使用更加便捷。
perf script
perf script子命令可以展示最原始的采样细节(比perf record & report还要丰富的细节)。
在通过perf record子命令记录了cpu-cycles的事件后,再利用perf script子命令就可以解析出最原始的采样信息,但这种信息不利于人眼解读
perf 202 [000] 1724.046093:    1 cycles ffffffe000495664 generic_exec_single+0x88
perf 202 [000] 1724.046109: 4096 cycles ffffffe000495664 generic_exec_single+0x88
perf 202 [000] 1724.046117: 4096 cycles ffffffe000495664 generic_exec_single+0x88
perf 202 [000] 1724.046125:11264 cycles ffffffe000495664 generic_exec_single+0x88
perf 202 [000] 1724.046166:46273 cycles ffffffe000abc7a8 _raw_spin_unlock_irqrest+0x3c
perf 202 [001] 1724.046257:    1 cycles ffffffe000495664 generic_exec_single+0x88
perf 202 [001] 1724.046270: 4096 cycles ffffffe000495664 generic_exec_single+0x88
perf 202 [001] 1724.046279: 4096 cycles ffffffe000495664 generic_exec_single+0x88
perf 202 [001] 1724.046287:13184 cycles ffffffe000495664 generic_exec_single+0x88
perf 202 [001] 1724.046334:57314 cycles ffffffe0007c66c2 strncpy_from_user+0x40
火焰图
因此perf script主要被用来生成perf.unfold文件,被交给一个名叫FlameGraph(火焰图)的工具,这个工具会解析perf.unfold数据,然后将其转换成易于人类阅读和分析的图形。
下载安装 FlameGrap 工具:
wget "https://github.com/brendangregg/FlameGraph/archive/master.zip"
unzip master.zip
On CPU火焰图
如果希望了解CPU在一段时间内的都运行了哪些函数以及各函数都消耗了多少时间,就可以使用On CPU火焰图,这种火焰图基于cpu-cycles事件进行采样,然后通过svg图片格式展现出来
dd if=/dev/zero of=/tmp/testfile bs=4K count=102400 &
perf record -e cpu-cycles -a -g sleep 1
perf script > perf.unfold
cd FlameGraph-master
./stackcollapse-perf.pl < ../perf.unfold | ./flamegraph.pl > ../perf.svg
首先在后台启动一个dd命令,让它持续运行一段时间,然后开启perf record,记录一秒钟内cpu都运行了多少个cpu-cycles,也就是时间(同时使能-g,就会一并记录运行的函数以及调用关系),再利用perf script命令将perf.data转成perf.unfold,最后利用FlameGraph工具将其转换成一个perf.svg,这是一个图形文件,用浏览器打开后会得到这样一幅图:
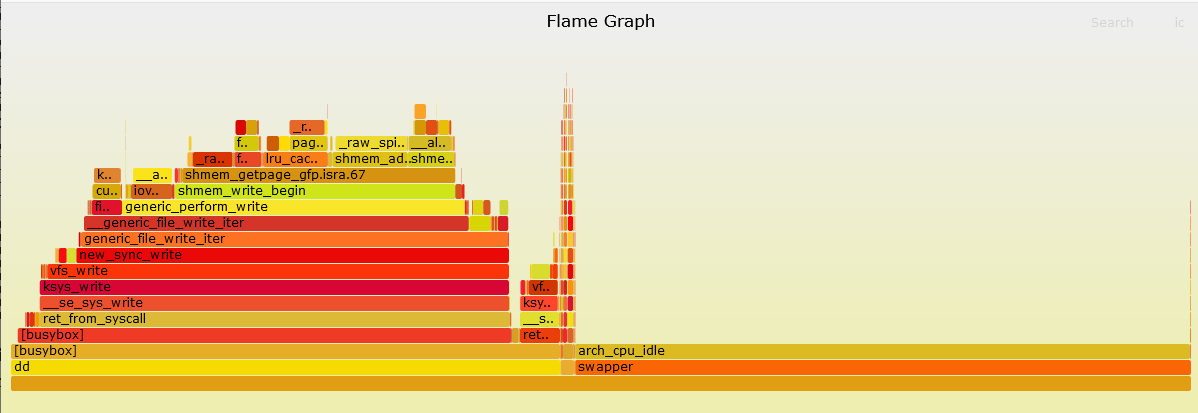
此图记录着函数调用关系及其cpu-cycles(时间)占比,就像一缕缕升起的火苗,所以被称之为火焰图。
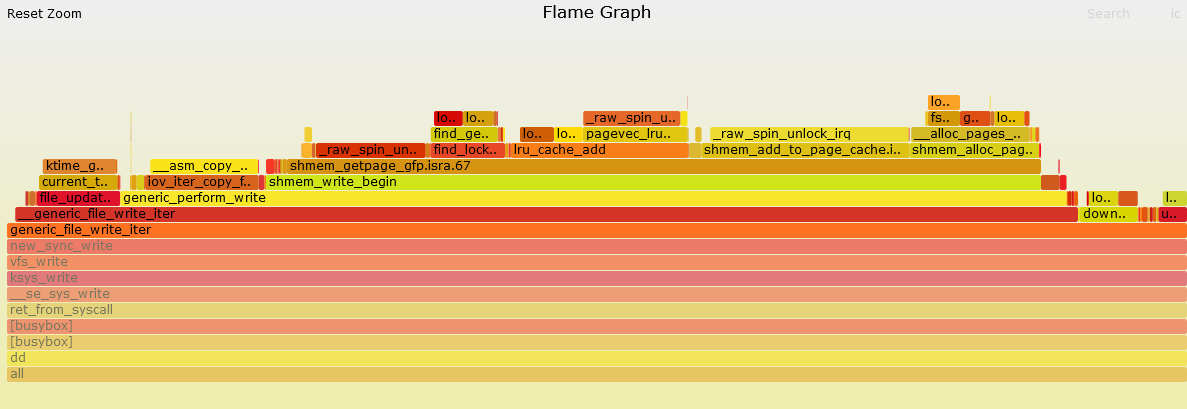
火焰图还可以通过鼠标点击放大,观察其细节,如下:
Mem火焰图
火焰图当然也可以基于内存,但目前基于内存的事件玄铁910还未支持,所以暂时用page fault事件来代替
perf record -e page-faults -a -g sleep 1
perf script > perf.unfold
cd FlameGraph
./stackcollapse-perf.pl < ../perf.unfold | ./flamegraph.pl --colors=mem > ../perf.svg
用浏览器打开perf.svg,就可以看到page fault发生的分布
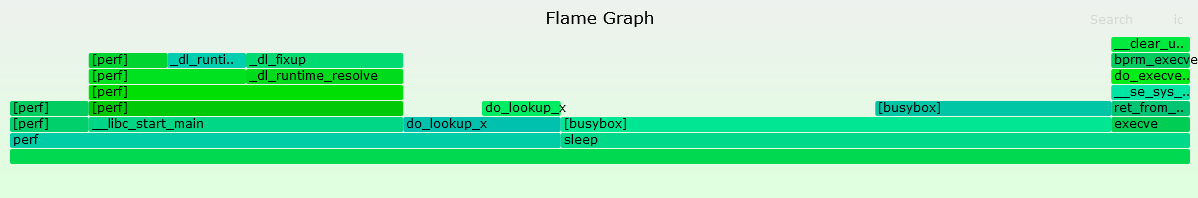
值得注意的是,Mem火焰图在生成时会使用--colors=mem参数,来生成一个绿色的火焰图,以示和On CPU火焰图的区别。
如果能基于malloc进行采样的话,就可以分析出一个应用程序调用malloc的分布
但可惜现在还有点bug,正在修复中
Off CPU火焰图
如果要看看CPU对IO的使用情况,可以制作Off CPU火焰图。
但目前Off CPU火焰图现在还有些问题,正在修复中。
Diff火焰图
diff火焰图可以将2个unfold文件进行对比,然后生成一个总的Diff火焰图,这样就可以清晰地看出2个火焰图的差异。
如果需要分析诸如”两种配置参数下性能差异的问题“,这将会是非常好的方法。
使用方法和上述方法无异,只是要将生成的fold文件使用difffold.pl进行输出即可
./difffolded.pl perf.folded1 perf.folded2 | ./flamegraph.pl > diff.svg
perf timechart
火焰图适合分析热点函数,或者指令,但若想分析时序问题(进程/或者cpu在一段时间内都在干什么,例如狂占cpu,或者idle,或者在等待io),就得使用perf timechart子命令。
为了展示timechart的作用,先跑起2个cpu消耗型的测试程序,代码如下:
void *a(void *p)
{
    while (1) {
        for (int i = 0; i < 100000000; i++);
        usleep(200000);
    }
    return NULL;
}

void *b(void *p)
{
    while (1) {
        for (int i = 0; i < 100000000; i++);
        usleep(200000);
    }
    return NULL;
}

int main(void)
{
    pthread_t t1, t2;
    pthread_create(&t1, NULL, a, NULL);
    pthread_create(&t2, NULL, b, NULL);
    pthread_join(t1, NULL);
    pthread_join(t2, NULL);
    return 0;
}
./test &
perf timechart record -g -a sleep 3
perf timechart
然后启动perf timechart子命令开始记录,最后再用perf timechart子命令生成一个output.svg图,将之用浏览器打开
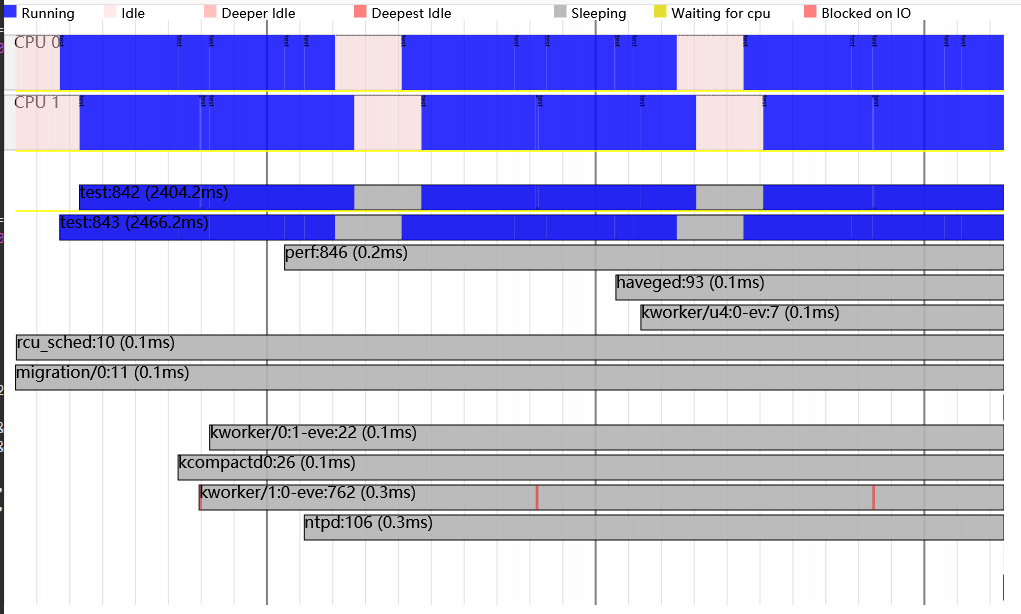
图中最上方的标记所示解释了每个颜色的含义
接下来两行表示两个cpu的运行状态,如果所示,两个cpu大部分时间里都是处于Running状态的,只有少部分事件是处于Idle
再接下来就是每个进程小号cpu的情况了,如果所示,大部分进程都是灰色的,表示它们都在sleeping,处于一个等待调度的状态,由于系统负载很低,它们即使被调度到了,也不干什么事情,所以看上去就一直处于一个灰色的状态。
综上,perf的基础子命令就介绍完了
总结一下:
perf的list子命令可以展示所有的事件
perf可以通过stat子命令直接展示信息
- 也可以通过record子命令生成perf.data,然后利用report展示更多的信息,但script命令可以展示最原始的信息,但并易于阅读,所以可以用来生成火焰图
- perf的stat子命令也可以读取perf.data(这有点特殊,只在perf kmem子命令中被用到)
- perf的probe子命令可以不修改代码地增加观测事件
接下来介绍perf功能型子命令
perf lock
perf lock子命令可以展示一定时间内系统对锁的使用情况
perf lock record -a sleep 1
perf report
# Samples: 38K of event 'lock:lock_acquire'
# Event count (approx.): 38474
    89.15%  perf             [unknown]         [.] 0000000000000000
     8.35%  swapper          [unknown]         [.] 0000000000000000
     1.05%  rcu_sched        [unknown]         [.] 0000000000000000
     0.92%  sleep            [unknown]         [.] 0000000000000000
     0.18%  ksoftirqd/1      [unknown]         [.] 0000000000000000
     0.11%  ntpd             [unknown]         [.] 0000000000000000
     0.06%  kcompactd0       [unknown]         [.] 0000000000000000
     0.05%  haveged          [unknown]         [.] 0000000000000000
     0.04%  kworker/1:0-mm_  [unknown]         [.] 0000000000000000
     0.04%  migration/1      [unknown]         [.] 0000000000000000
     0.03%  kworker/0:1-mm_  [unknown]         [.] 0000000000000000
     0.03%  migration/0      [unknown]         [.] 0000000000000000
# Samples: 25K of event 'lock:lock_contended'
# Event count (approx.): 25431
    91.47%  perf             [unknown]         [.] 0000000000000000
     6.49%  swapper          [unknown]         [.] 0000000000000000
     1.05%  rcu_sched        [unknown]         [.] 0000000000000000
     0.66%  sleep            [unknown]         [.] 0000000000000000
     0.08%  ntpd             [unknown]         [.] 0000000000000000
     0.06%  kcompactd0       [unknown]         [.] 0000000000000000
     0.04%  migration/1      [unknown]         [.] 0000000000000000
     0.04%  haveged          [unknown]         [.] 0000000000000000
     0.04%  migration/0      [unknown]         [.] 0000000000000000
     0.02%  kworker/0:1-mm_  [unknown]         [.] 0000000000000000
     0.02%  kworker/1:0-mm_  [unknown]         [.] 0000000000000000
     0.02%  ksoftirqd/1      [unknown]         [.] 0000000000000000
# Samples: 38K of event 'lock:lock_release'
# Event count (approx.): 38448
    89.14%  perf             [unknown]         [.] 0000000000000000
     8.36%  swapper          [unknown]         [.] 0000000000000000
     1.05%  rcu_sched        [unknown]         [.] 0000000000000000
     0.93%  sleep            [unknown]         [.] 0000000000000000
     0.18%  ksoftirqd/1      [unknown]         [.] 0000000000000000
     0.11%  ntpd             [unknown]         [.] 0000000000000000
     0.06%  kcompactd0       [unknown]         [.] 0000000000000000
     0.05%  haveged          [unknown]         [.] 0000000000000000
     0.04%  migration/1      [unknown]         [.] 0000000000000000
     0.03%  kworker/0:1-mm_  [unknown]         [.] 0000000000000000
     0.03%  migration/0      [unknown]         [.] 0000000000000000
     0.03%  kworker/1:0-mm_  [unknown]         [.] 0000000000000000
perf report展示了1秒钟内,系统的锁获取,锁竞争,锁释放的情况
perf lock子命令,其实就是tracepoint event采样事件中的lock事件
perf list lock
... ...
lock:lock_acquire                                  [Tracepoint event]
lock:lock_acquired                                 [Tracepoint event]
lock:lock_contended                                [Tracepoint event]
lock:lock_release                                  [Tracepoint event]
... ...
像这样的子命令,还有perf kmem和perf sched,但它们又不仅仅是一个简单的wrapper,而是具有更加具有可读性的展示。
perf kmem
perf kmem子命令用于记录内核slab分配器的事件,使用的是tracepoint event中的kmem事件类型
perf kmem record ls
perf kmem stat
SUMMARY (SLAB allocator)
========================
Total bytes requested: 56220
Total bytes allocated: 56824
Total bytes freed:     52968
Net total bytes allocated: 3856
Total bytes wasted on internal fragmentation: 604
Internal fragmentation: 1.062931%
Cross CPU allocations: 0/55
简单的stat输出的信息只是一个概要,但如果使用
perf kmem --alloc --caller --slab stat
就会展示更加丰富的信息
-------------------------------------------------------------
 Callsite | Total_alloc | Total_req | Hit | Ping-pong | Frag
-------------------------------------------------------------
 load_elf_phdrs+6e     | 512/512  | 280/280 | 1 | 0 | 45.312%
 __alloc_skb+98        | 1024/1024| 576/576 | 1 | 0 | 43.750%
 proc_self_get_link+b6 | 16/16    | 11/11   | 1 | 0 | 31.250%
 ext4_readdir+5e8      | 64/64    | 48/48   | 1 | 0 | 25.000%
 alloc_bprm+46         | 1024/512 | 832/416 | 2 | 1 | 18.750%
... ...
--------------------------------------------------------------
--------------------------------------------------------------
--------------------------------------------------------------
 0xffffffe0000c9e00 |  512/512   | 280/280   | 1 | 0 | 45.312%
 0xffffffe00010e000 | 1024/1024  | 576/576   | 1 | 0 | 43.750%
 0xffffffe00201b2b0 |   16/16    |  11/11    | 1 | 0 | 31.250%
 0xffffffe0000dba80 |   64/64    |  48/48    | 1 | 0 | 25.000%
 0xffffffe0000db780 |   64/64    |  50/50    | 1 | 0 | 21.875%
... ...
其中Callsite记录了调用kmalloc的地方,Hit记录了调用的次数,Total_alloc/Per记录了分配的大小,Frag表示碎片占比,Ping-pong记录了申请内存和释放内存是否在同一个cpu上,这对于cache的性能调优会有所助益,Alloc Ptr由--alloc选项导出,记录了申请的内存的虚拟地址。
perf sched
perf sched子命令用于记录内核调度相关的事件,使用的是tracepoint event中的sched事件类型
perf sched record ls
在通过record记录了sched事件后,可以通过report和script来查看,这里就不举例了,来看看perf sched子命令有什么强力的拓展
通过dd命令生成一个文件在eMMC上(这样才能看到明显的延迟,DDR上的操作延迟太小)
perf sched record dd if=/dev/zero of=./testfile bs=4K count=1024
perf sched latency
 ------------------------------------------------------------------------------------
  Task | Runtime ms | Switches | Avg delay | Max delay | Max delay start | Max delay end
 ------------------------------------------------------------------------------------
  dd:312           |68.054 ms | 2 | 0.210 ms | 0.420 ms | 629.787396 s | 629.787816 s
  sshd:272         | 0.327 ms | 1 | 0.000 ms | 0.000 ms |   0.000000 s |   0.000000 s
  kworker/u4:0-ev:7| 0.125 ms | 1 | 0.000 ms | 0.000 ms |   0.000000 s |   0.000000 s
  migration/1:14   | 0.000 ms | 1 | 0.000 ms | 0.000 ms |   0.000000 s |   0.000000 s
  migration/0:11   | 0.000 ms | 1 | 0.000 ms | 0.000 ms |   0.000000 s |   0.000000 s
 ------------------------------------------------------------------------------------
  TOTAL:                |     68.691 ms |        7 |
 ------------------------------------------------------------------------------------
可以看到,所有dd相关的进程的延迟信息都被展现出来了
perf sched map
# perf sched map
  *A0        1021.655030 secs A0 => migration/0:11
  *.         1021.655100 secs .  => swapper:0
  *B0        1021.655570 secs B0 => perf:334
   B0 *.     1021.655880 secs
  *C0  .     1021.658667 secs C0 => rcu_sched:10
  *B0  .     1021.658719 secs B0 => dd:334
  *C0  .     1021.666567 secs
  *B0  .     1021.666601 secs
  *D0  .     1021.722001 secs D0 => kworker/u4:2-ev:314
  *E0  .     1021.722097 secs E0 => sshd:322
  *B0  .     1021.722419 secs
  *C0  .     1021.722575 secs
  *B0  .     1021.722612 secs
   B0 *F0    1021.722897 secs F0 => perf:333
  *.   F0    1021.722914 secs
   .  *G0    1021.723142 secs G0 => migration/1:14
  *F0  G0    1021.723200 secs
   F0 *.     1021.723219 secs
   F0 *F0    1021.723393 secs
perf sched map展示了调度信息的一个总览,*表示发生调度,点表示该cpu处于idle
perf sched timehist
Samples do not have callchains.
           time    cpu  task name                       wait time  sch delay   run time
                        [tid/pid]                          (msec)     (msec)     (msec)
--------------- ------  ------------------------------  ---------  ---------  ---------
    1021.655030 [0000]  perf[333]                           0.000      0.000      0.000
    1021.655100 [0000]  migration/0[11]                     0.000      0.025      0.069
    1021.655570 [0000]  <idle>                              0.000      0.000      0.470
    1021.655880 [0001]  perf[333]                           0.000      0.000      0.000
    1021.658667 [0000]  dd[334]                             0.000      0.032      3.097
    1021.658719 [0000]  rcu_sched[10]                       0.000      0.116      0.052
    1021.666567 [0000]  dd[334]                             0.052      0.000      7.848
    1021.666601 [0000]  rcu_sched[10]                       7.848      0.049      0.033
    1021.722001 [0000]  dd[334]                             0.033      0.000     55.400
    1021.722097 [0000]  kworker/u4:2-ev[314]                0.000      0.074      0.095
    1021.722419 [0000]  sshd[322]                           0.000      0.059      0.322
    1021.722575 [0000]  dd[334]                             0.418      0.000      0.156
    1021.722612 [0000]  rcu_sched[10]                      55.974      0.035      0.037
    1021.722897 [0001]  <idle>                              0.000      0.000     67.017
    1021.722914 [0000]  dd[334]                             0.037      0.000      0.301
    1021.723142 [0001]  perf[333]                          67.017      0.046      0.245
    1021.723200 [0000]  <idle>                             67.344      0.000      0.286
    1021.723219 [0001]  migration/1[14]                     0.000      0.026      0.077
    1021.723393 [0001]  <idle>                              0.322      0.000      0.173
timehist可以展示这一秒钟内,所有进程的调度情况,wait time表示从被唤醒到开始调度的时间,sch delay表示从开始调度到真正运行的时间。
perf top
perf top子命令动态地显示各种采样事件,以下是2个实例
hardware event之instructions
perf top -e instructions
    10.87%  [kernel]          [k] format_decode
     8.26%  [kernel]          [k] number
     6.86%  [kernel]          [k] kallsyms_expand_symbol.constprop.8
     5.32%  [kernel]          [k] vsnprintf
     3.47%  [kernel]          [k] string_nocheck
     2.95%  perf              [.] 0x00000000000948f0
     2.78%  libc-2.29.so      [.] memcpy
     2.48%  libc-2.29.so      [.] strcmp
     2.38%  [kernel]          [k] update_iter
     2.20%  libc-2.29.so      [.] strchr
     2.10%  libc-2.29.so      [.] __libc_calloc
     1.70%  libc-2.29.so      [.] memset
     1.45%  perf              [.] 0x0000000000082b78
     1.43%  libc-2.29.so      [.] strlen
     1.29%  perf              [.] 0x0000000000082c06
     1.20%  [kernel]          [k] __softirqentry_text_start
     1.15%  [kernel]          [k] _raw_spin_unlock_irqrestore
     1.10%  libc-2.29.so      [.] 0x000000000006247e
     1.09%  [kernel]          [k] seq_vprintf
     0.93%  perf              [.] 0x0000000000082b68
tracepoint event之sched:sched_wakeup
perf top -e sched:sched_wakeup
    32.60%  comm=perf pid=416 prio=120 target_cpu=001
    30.39%  comm=perf pid=412 prio=120 target_cpu=001
    17.40%  comm=kworker/0:1H pid=40 prio=100 target_cpu=000
     3.31%  comm=ksoftirqd/0 pid=9 prio=120 target_cpu=000
     3.04%  comm=kcompactd0 pid=26 prio=120 target_cpu=000
     2.76%  comm=ntpd pid=105 prio=120 target_cpu=001
     2.49%  comm=kcompactd0 pid=26 prio=120 target_cpu=001
     2.49%  comm=kworker/0:1 pid=22 prio=120 target_cpu=000
     2.49%  comm=kworker/1:0 pid=16 prio=120 target_cpu=001
     2.49%  comm=perf pid=413 prio=120 target_cpu=000
     0.28%  comm=haveged pid=93 prio=120 target_cpu=000
     0.28%  comm=perf-top-UI pid=417 prio=120 target_cpu=000
如果跟上call-graph功能,perf top子命令将会展示更丰富的函数调用细节
perf top -e instructions --call-graph graph
    16.69%     0.45%  [kernel]            [k] seq_read_iter
            |
             --0.63%--seq_read_iter
                       |
                       |--0.98%--s_next
                       |          |
                       |           --0.89%--update_iter
                       |
                        --0.64%--s_show

    14.81%     0.18%  [kernel]            [k] s_show
    14.25%     0.16%  [kernel]            [k] seq_printf
    14.20%     0.48%  [kernel]            [k] seq_vprintf
            |
             --4.51%--seq_vprintf
                       |
                       |--5.70%--vsnprintf
                       |          |
                       |          |--4.11%--pointer
                       |          |          |
                       |          |           --3.56%--number
                       |          |
                       |          |--2.57%--format_decode
                       |          |
                       |           --2.36%--string
                       |                     |
                       |                      --2.10%--string_nocheck
                       |
                        --1.42%--format_decode
perf bench
perf bench子命令是perf内部集成的一个benchmark测试程序,可以看一下perf bench支持哪些benchmark
perf bench
         sched: Scheduler and IPC benchmarks
       syscall: System call benchmarks
           mem: Memory access benchmarks
         futex: Futex stressing benchmarks
         epoll: Epoll stressing benchmarks
     internals: Perf-internals benchmarks
           all: All benchmarks
可见,benchmark有sched,syscall,mem等几大类
perf bench mem
        memcpy: Benchmark for memcpy() functions
        memset: Benchmark for memset() functions
      find_bit: Benchmark for find_bit() functions
           all: Run all memory access benchmarks
而mem里又包含了3个测试点
perf bench mem memcpy
# Running 'mem/memcpy' benchmark:
# function 'default' (Default memcpy() provided by glibc)
# Copying 1MB bytes ...

       5.778476 GB/sec
perf bench mem memset
# Running 'mem/memset' benchmark:
# function 'default' (Default memset() provided by glibc)
# Copying 1MB bytes ...

       6.300403 GB/sec
perf archive
如果想将采集到的perf.data交给其他人分析,此时仅把perf.data丢给他是不够的,这里就要用到perf archive子命令将perf.data以及相关符号信息打包后,再传给其他人,这样别人就也能分析这个perf.data了。
但目前该功能还有些问题,正在修复中。
perf evlist
perf evlist子命令可以分析出perf.data是基于什么事件采样的
perf evlist
kmem:kmalloc
kmem:kmalloc_node
kmem:kfree
kmem:kmem_cache_alloc
kmem:kmem_cache_alloc_node
kmem:kmem_cache_free
dummy:HG
可以看到,这个是一个基于kmem事件采样的perf.data
perf kallsyms
perf kallsyms子命令可以用于探测一个函数是否存在于内核符号表中,从而决定它是否可以作为一个perf probe的对象
perf kallsyms schedule
schedule: [kernel] [kernel.kallsyms] 0xffffffe000abf44a-0xffffffe000abf52c (0xffffffe000abf44a-0xffffffe000abf52c)
当然,还可以通过
cat /proc/kallsyms | grep schedule
来判断一个函数是不是一个在内核符号表中。